Building for production
Infrastructure code is surrounded by an aura of mystery. In reality, it’s very similar to your plain old web app. It just happens to run in a part of the stack most people don’t touch.
If you work in a big corp, you’re probably used to do (some of) the following with every code push to main:
- Add unit tests
- Add at least one integration test
- Add monitoring via metrics/logs
- Test the release in staging (bonus points)
- Have a rollback plan (more bonus points)
- Write docs (I’m pushing it, nobody does that)
If we apply the same methodology to infrastructure, we can adapt the same fast release cadence to an area of the stack that typically gets upgraded once a year. And that allows us to build cool things, fast.
PgDog is preparing for its production release. In this post, I’m going to take you through our process and how we learned to iterate on live wires while wearing rubber gloves. We’re overachievers, so we’re going for bonus points.
It’s good to be a proxy
PgDog is a proxy, so our job is to return the same bytes that Postgres would if we weren’t there. Sure, we manipulate those bytes, especially when multiple databases are involved, but the client(s) ultimately tell us if we did the job right.
To validate that we are not breaking things, we are writing a test suite for every programming language (and Postgres client driver). It may seem like overkill, but the Postgres wire protocol is flexible. Different clients do different things at different stages of query execution, and we need to handle it all.
Currently, we have tests written in the following languages and frameworks:
asyncpg(Python)psycopg(also Python)- SQLAlchemy (using
asyncpg) pg(Ruby)- Rails/ActiveRecord (using
pgunderneath) node-postgres(JavaScript)sqlx(Rust)tokio_postgres(Rust)- PostgreSQL JDBC (Java)
Some may feel redundant, but they are really not. Each driver does something different, and while we could have just read the Postgres protocol spec (we did), implementing it from documentation without integration tests wouldn’t be wise.
Testing each message
Things inside PgDog can get pretty interesting, especially when we start (re)calculating aggregates or sorting rows in multi-shard queries. For this to work, we have to decode every single row (and supported data type) coming from the database.
To make sure we do this right, we run an integration test against Postgres directly. Each message decoding and encoding implementation is tested against the real thing. You’d be surprised how many clients use binary encoding (looking at you, asyncpg). Joking aside, this is actually a good thing. Every nanosecond of performance matters.
With performance in mind, we use bytes::Bytes as many places as we can. This allows us to allocate memory once per client request. Allocations do add up and memory fragmentation is a real bottleneck in high throughput systems, like a proxy.
Caching
Much like you’d use Redis (or Memcached, if you’re old school, like me) to cache hot data in your web app, PgDog uses its own memory cache to save expensive computations. One particular feature of PgDog, parsing SQL, is relevant.
Parsing SQL isn’t free. Doing so for each query would add noticeable latency and wouldn’t be ideal at scale. To mitigate this, PgDog stores prepared statements using an internal, in-memory, key/value store. The key is the query, while the value is the AST produced by pg_query.
Using a cache improves PgDog’s latency by 30x. Better yet, this problem doesn’t require cache invalidation. Abstract Syntax Trees don’t change unless the query does, so this cache needs to be populated once, on startup. Your app doesn’t have to use actual prepared statements to benefit from this. You just need to send the statement text and parameters separately, as most PostgreSQL drivers do.
Chaos testing
Chaos engineering is a discipline of breaking things on purpose. It was invented by infra engineers who wanted to see what a worst case scenario looks like. Big companies like Netflix and Google even break production, on purpose, just to see what happens.
PgDog isn’t as big as Google yet, but we do practice our own form of chaos testing. To do that, we use Toxiproxy. Written by engineers at Shopify and with bindings for most languages, it allows us to simulate different kinds of network failure between PgDog and the database.
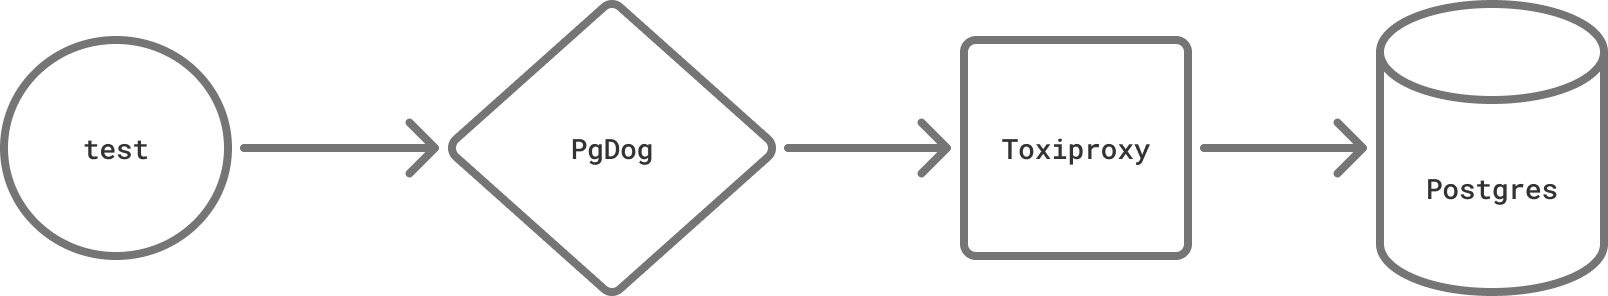
Have you ever read the TCP spec? Most people haven’t. For a protocol that’s supposed to make network communication reliable, it has quite a few error states. We test all of them using Toxiproxy.
Two failure modes are top of mind:
- Connection reset by peer (you’ve seen this one many times)
- Data goes down a black hole, never to be heard from again (less common, more annoying)
The first one happens when a Postgres database is rebooted or suddenly shut down. This sends a TCP RST message on all connections, which is easily detectable by the application layer (e.g., TcpStream in Tokio).
It’s a good time to mention that PgDog has a real-time, in-memory, list of bad hosts. If a host fails a health check or breaks a TCP connection, it’s removed from active rotation and traffic is re-routed to other replicas. A TCP RST, aka “Connection reset by peer”, is an immediate signal that something went wrong and we can act on it right away.
The second failure mode happens when things are really not going well. Quick detour into how Postgres wire protocol works first.
It’s quiet in here
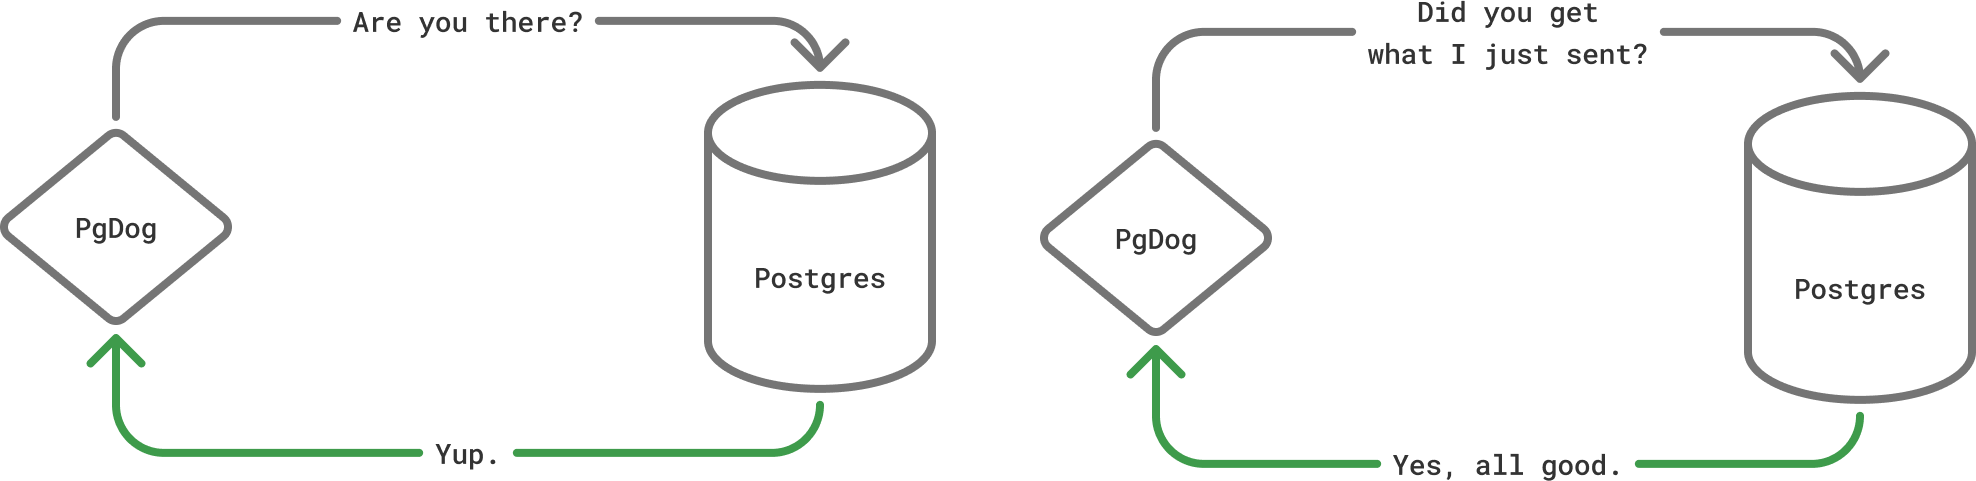
Postgres wire protocol isn’t very chatty: clients and servers don’t talk to each other unless they have something to say. There are no periodic health checks and “are you still there”-type messages. More interestingly, unlike MySQL, Postgres drivers typically don’t have a read_timeout setting.
This means that clients executing queries will wait until Postgres answers with a result, however long that may take. This isn’t an issue normally, since we can abort query execution at the server using statement_timeout. But, what if the server itself is waiting for something that will never happen?
Proxies are everywhere
If you’re using a public cloud, like AWS RDS or Azure, your database data isn’t actually stored on the same machine. Storage and compute have been separated for over a decade. RDS uses EC2, and EC2 uses EBS, which is a type of low latency network-attached storage.
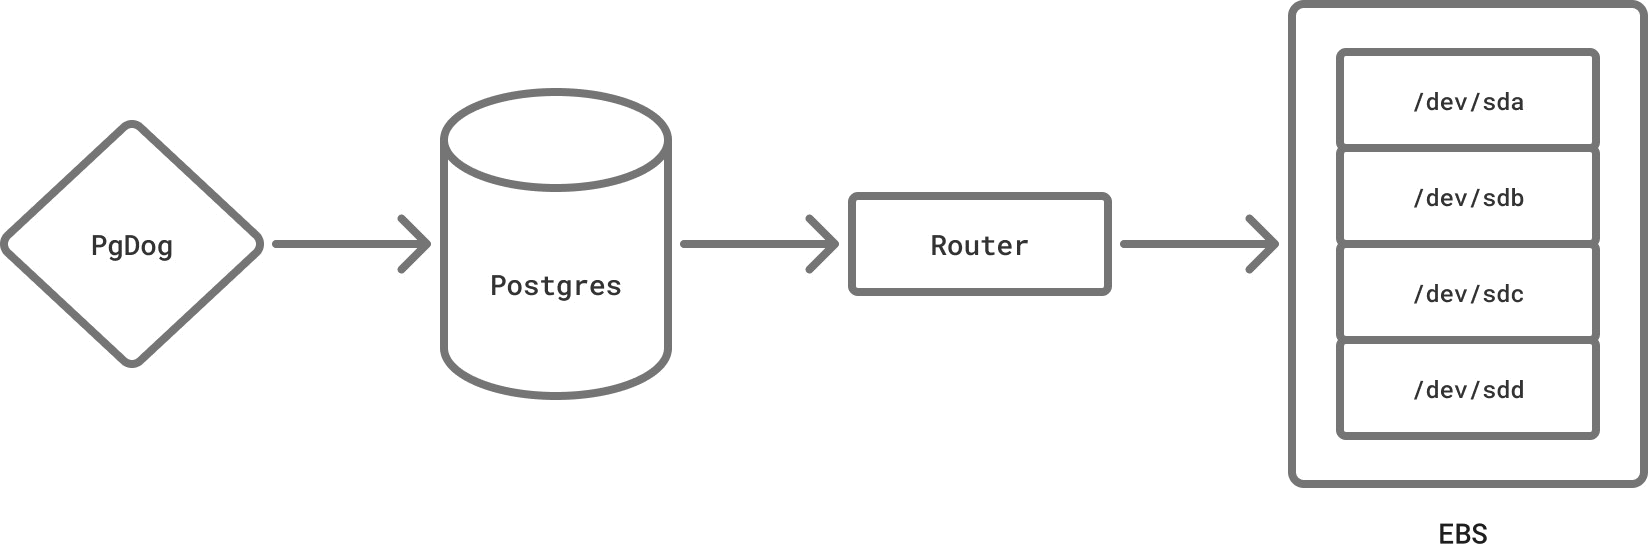
Postgres storage layer (known on the mailing lists as md.c) mostly relies on the kernel. The kernel relies on the file system driver, and the EBS driver is a proxy to an NVMe rack, in a different part of the building. We finally came full circle.
So, what happens when somebody trips over the Ethernet cable? Postgres waits on the file system, which waits on the driver, which waits on the network, which is now a black hole. This type of error isn’t frequent, but it does happen at scale. Back when I was at Instacart, we saw it a few times: our apps would just wait, and wait, until an application-side timeout was triggered, and the whole deployment went down.
You might be thinking: EBS has its own high availability system and recovers from errors automatically. That’s true, but when you’re writing a lot of data, even a short period (90 seconds, or so) of increased latency, while the system recovers, has cascading effects. We ran multiple replicas, and when one would slow down, we could have switched to another without much more than a blip on our Datadog dashboard.
That’s why chaos testing is a good thing. Lessons are learned in production, by breaking things we take for granted.
Detecting black holes
Unlike the real thing, TCP black holes can be detected using 3 different mechanisms. PgDog implements all of them. The first is called TCP keep-alives. They are messages sent by the kernel to ensure the TCP connection is still operational. This helps with finding broken routers.
The second one is TCP user timeout, a setting only available on Linux, that basically implements read_timeout on the TCP layer. All data sent over the socket is acknowledged by the kernel on the other side, and this feature throws an error if this doesn’t happen in a reasonable amount of time.
The last one is done at the application layer by PgDog and is controlled with the query_timeout setting. Since PgDog keeps track of each connection, it knows when Postgres should be saying something. If it doesn’t, within a configured amount of time, PgDog sends an error to the client and blocks the replica from serving any more traffic.
Unlike the first two, this is the only one that can detect file system failures. Since all 3 are network-based, they can be (and are) tested in our CI, using Toxiproxy.
Next steps
PgDog is only a few months old, but it’s been in development for much longer. We wrote PgDog’s predecessor, PgCat, to address some of these issues. We contributed bug reports and patches to PgBouncer before that and have been working with Postgres, in production, for years.
If any of this rings familiar or you’re just curious about the project, get in touch. We are looking for early design partners and feedback. A GitHub star for our open source project is always appreciated.