Everything for Postgres
to just work
PgDog is a connection pooler, load balancer and database sharder.
All components work together, in one executable, to make your database go brrr.
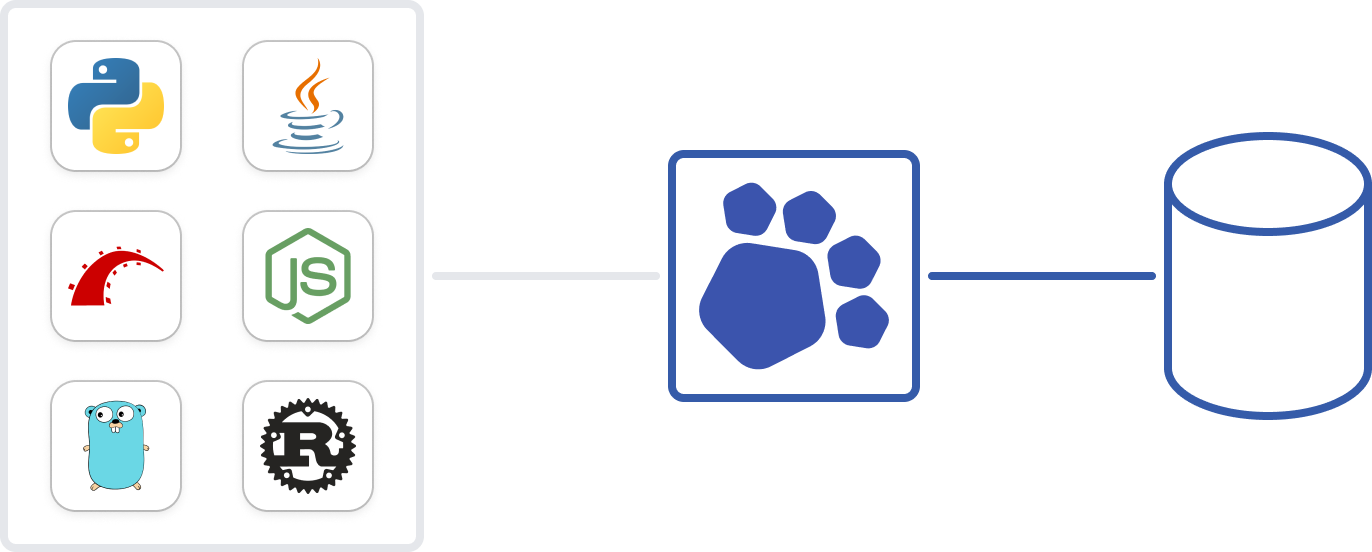
A modern PgBouncer
PgDog is multi-threaded, takes advantage of multiple CPUs, and can process more transactions per second.
Better transaction mode
PgDog handles prepared statements, SET statements and maintains per-client connection state, in transaction mode. Your application doesn't need to know it's using a connection pooler.
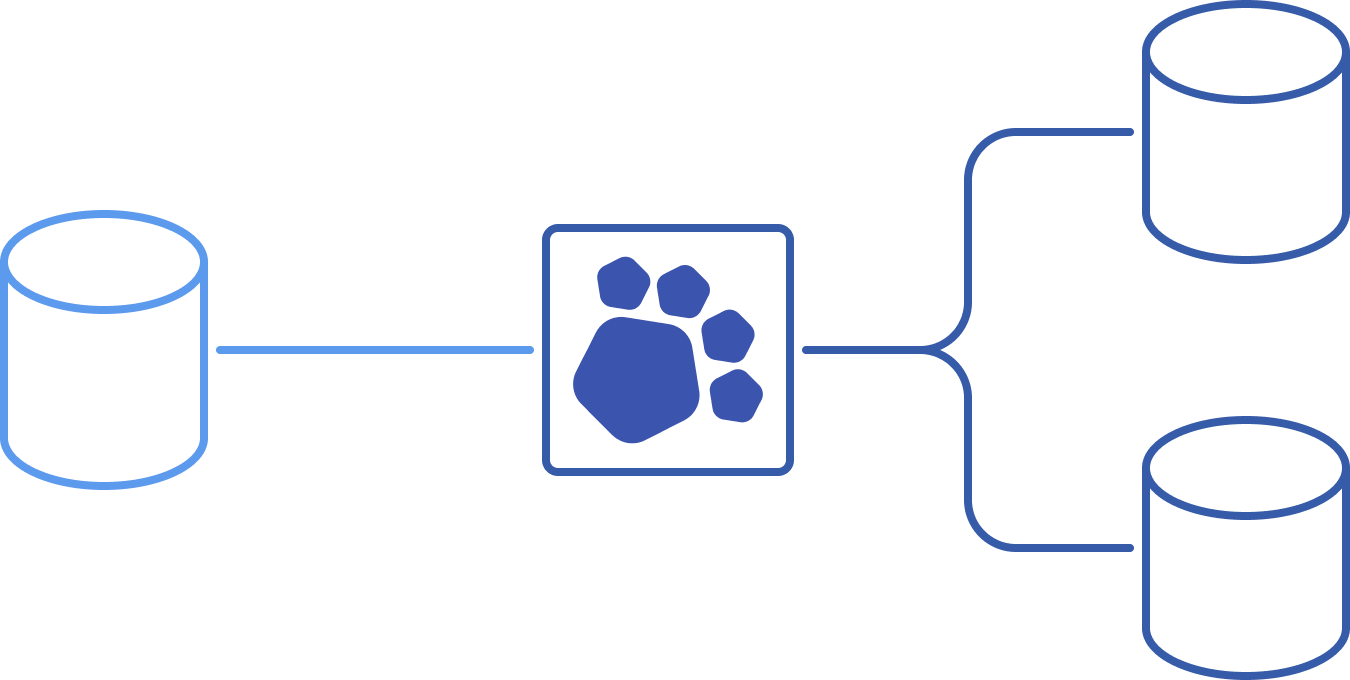
TCP proxies are old... school
You don't need to stack services on top of each other anymore. PgDog load-balances traffic on the transaction level, spreading the load evenly across your replicas.
One endpoint for all queries
PgDog comes with a SQL parser, extracted directly from the Postgres source code. It understands all queries and can split reads from writes, sending writes to the primary database.
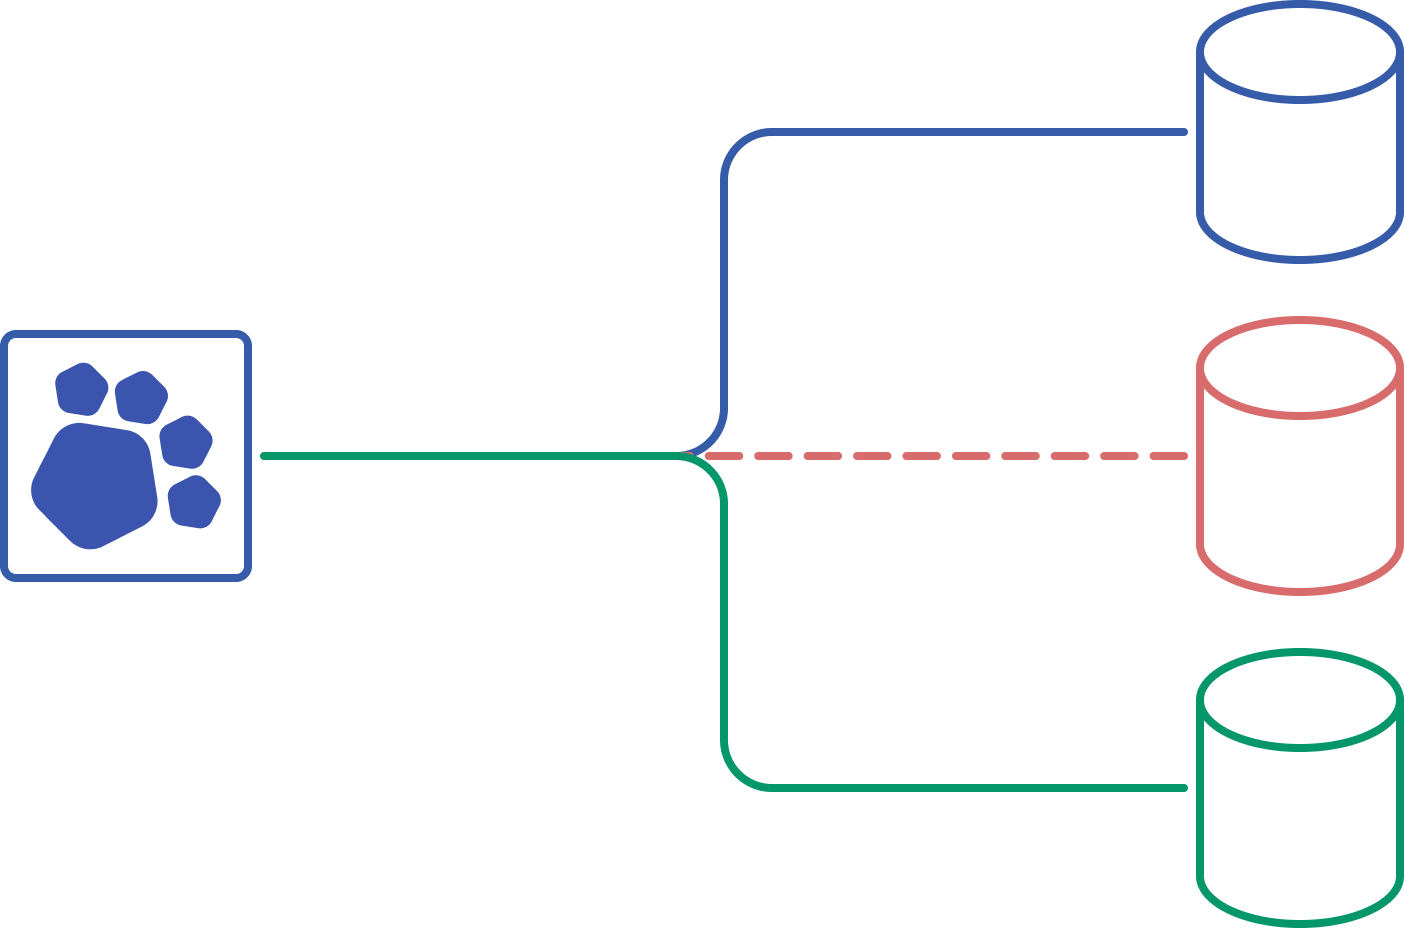
Automatic failover
PgDog can detect replica lag, broken hardware and primary failovers. It moves traffic automatically to healthy databases, giving your Postgres the four 9s of uptime.
One connection, many databases
With just plain old SQL, your application can use the same connection to talk to any database in your multi-tenant database cluster. Your queries just need a sharding key and PgDog will send them to the right database automatically.
Direct and cross-shard
PgDog has its own query engine that can interpret and execute queries on multiple databases in parallel. It works with aggregates, sorting, multi-tuple inserts, sharding key updates, and more.
1-- Direct-to-shard query.
2SELECT * FROM accounts
3WHERE tenant_id = $1;
4
5-- Cross-shard insert statement.
6INSERT INTO users (id, tenant_id, email)
7VALUES ($1, $2, $3),
8 ($4, $5, $6);Distributed SQL
PgDog supports replicated tables, cross-shard unique keys, two-phase transactions and more. It handles the complexity of distributed relational databases, without you having to rewrite your application.
Logical replication
PgDog understands the Postgres replication protocol and can copy tables between databases, while sharding rows in-flight. You can scale your database, over and over, online and without downtime.
In production
from day one
PgDog has been open source from the beginning. Adopted by dozens of companies and serving millions of queries per second, it was built together with the community.

Docker deployments
500k+
Designed to work in your cloud, you can install PgDog directly from our Docker repository.
Install PgDog chevron_right
GitHub stars
PgDog is a collaborative project with contributors from across the industry.
Give us a star chevron_rightBuilt to scale
any business
The open source version is great, but if you need more, we have you covered.
Control plane, metrics, alerts and more, in one all-inclusive package.
Second-granularity monitoring
Don't waste your time clicking refresh buttons only to see old data. PgDog collects metrics every second and delivers them in real time via a dedicated connection to our dashboard.
Graphs and dashboards
Built by people who spent the last decade deciphering cloud metrics, PgDog comes with its own web UI and pre-configured graphs and dashboards.
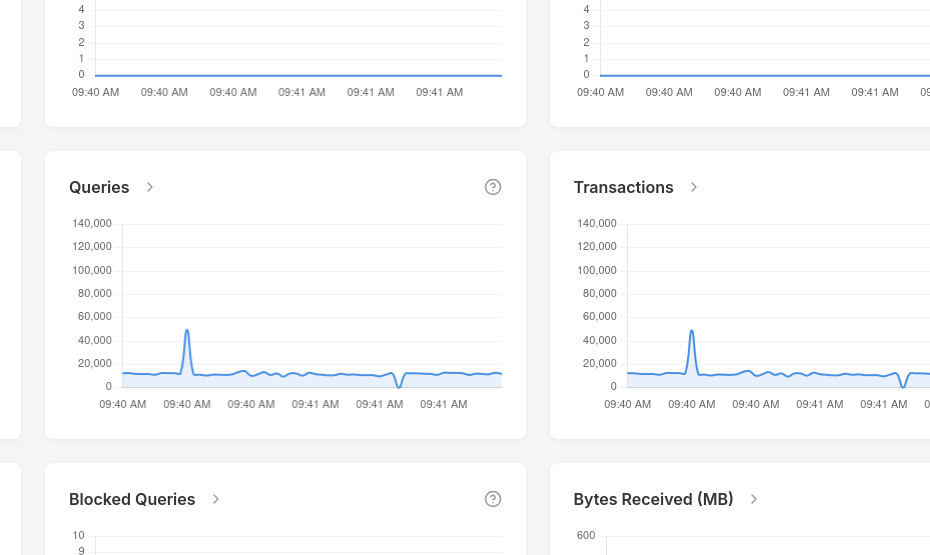
Queries and plans
PgDog keeps track of transactions in real time and fetches query plans for slow queries, as they are happening. Never miss a query plan flip again because it happened between collection periods.
What, where, and why
By combining metrics, query statistics and plans in one place, PgDog reduces the time to root cause database incidents to the time it takes to load the dashboard.
Default alerts
Never sleep through a production event because of a misconfigured alert. Pre-configured monitors are directly connected to PgDog metrics and will react to the same things you see.
Real-time integrations
No need to reinvent the wheel. PgDog alerts work with Incident.io, OpsGenie, PagerDuty and more. Connect your integration and manage incidents from either PgDog or the tool of your choice, with bi-directional data sync.
Managed, at-scale
Whether you're running one PgDog container or a thousand, our control plane makes sure you can control them all with a click of a button.
Zero downtime deploys
Deploy new versions of PgDog at any time, with zero downtime, using our proven blue/green strategy. Change a config, push a button, and let us do the work.
See PgDog
in action
Watch a two-minute demo of how PgDog manages a sharded PostgreSQL database.